

America’s Biggest Gambling States: Where Is the Most Money Being Spent?
Ask where America gambles the most, and Nevada is the obvious answer. After that, though, it’s anyone’s game. The industry looks different across the country. Some states have dozens of casinos and still get overtaken by places where lottery spending is bigger. Elsewhere, what stands out is how much of people’s income goes toward gambling.
To settle the question, our analysts at LegalUSPokerSites examined the latest publicly available data across all 50 states and compared them based on gambling spending, revenue, availability, and its share of residents’ income.
Key Highlights
- Nevada is in a league of its own: $15.5B in annual GGR, much of it tourist-driven, works out to $508 monthly per adult and 8.12% of personal income when spread across residents.
- America’s gambling map isn’t just Vegas: Tiny Rhode Island and Delaware both make the top five, despite having five casinos combined.
- The lottery can outweigh the casino floor: Massachusetts ranks #4 with just three casinos, fueled by $856 per person in ticket spending.
America’s Top Gambling States
Plenty can push a place into America’s top gambling states. Nevada came in first, no surprise with 440 casinos. Massachusetts, though, has just three and still finished only four spots back, helped by the country’s highest lottery spending per person. The table below combines gaming revenue, lottery play, monthly wagering per adult, and the share of personal income spent on betting into one overall ranking.
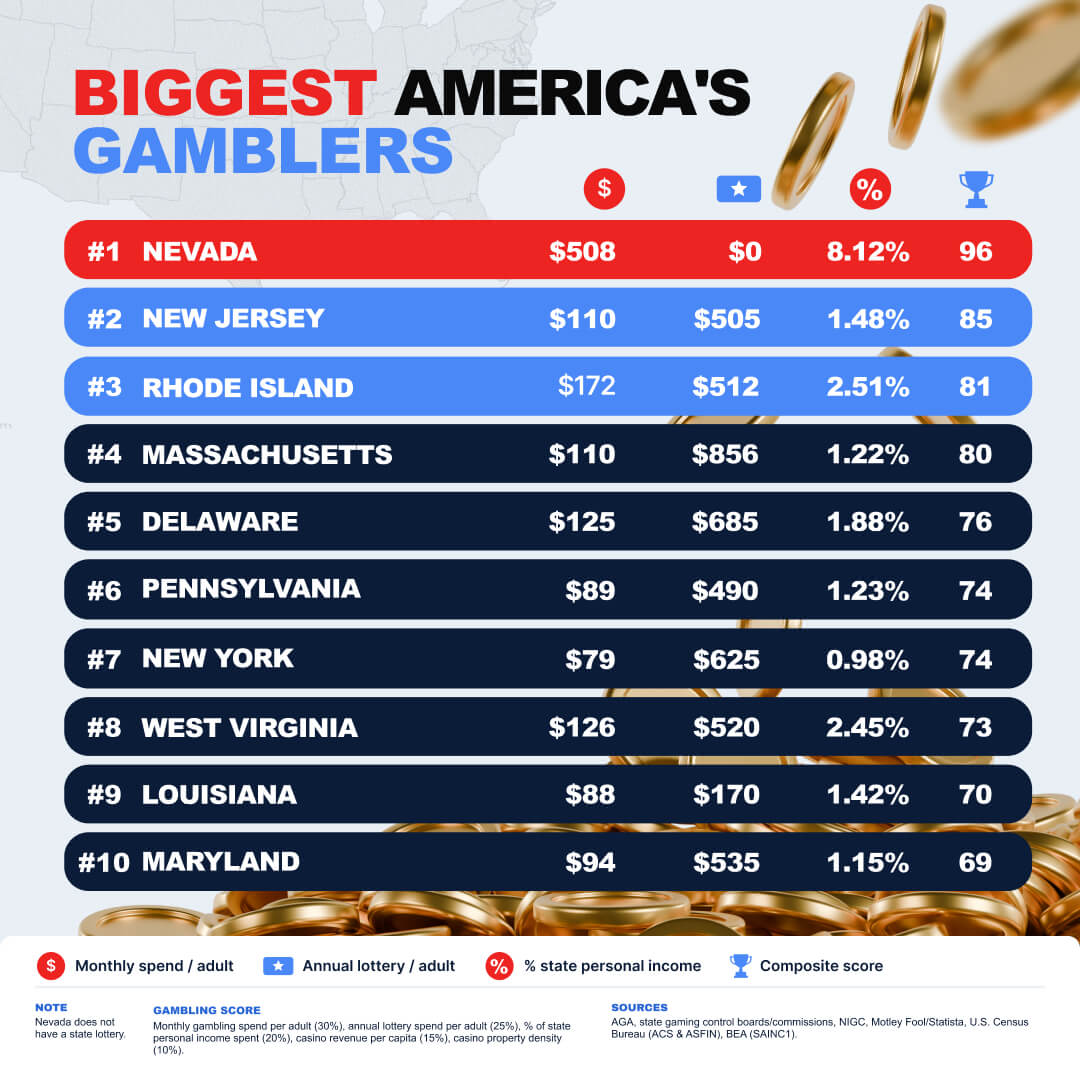
#10 Maryland: Index Score 69/100 🎰
Maryland made the top 10 with only six casinos, but you wouldn’t know it from the money they generate. Together, those properties make nearly twice what Colorado gets from 33. The lottery adds almost as much again, and on spending per person, Maryland comes in seventh, just behind South Carolina.
- Casinos: 6
- Annual casino GGR: $2.78 billion
- Monthly casino revenue: $231.7 million
- Annual lottery sales: $2.65 billion
- Lottery spend per capita: $535
- Estimated monthly gambling spend per adult: $93.60
- Gambling share of personal income: 1.15%
#9 Louisiana: Index Score 70/100 🎰
Louisiana has 24 casinos, and those properties bring in over five times the lottery’s annual ticket sales. Outside Nevada, nobody else in the top 10 spends less per person on lottery tickets.
- Number of casinos: 24
- Annual gross gaming revenue: $3.15 billion
- Monthly casino revenue: $262.5 million
- Annual lottery sales: $610 million
- Annual lottery spend per capita: $170
- Estimated monthly gambling spend per adult: $88.40
- Gambling as percentage of state personal income: 1.42%
#8 West Virginia: Index Score 73/100 🎰
West Virginia doesn’t look like much on the raw numbers. Then you stack the gambling spend against people's income, and there it is: 2.45% of personal earnings, third behind Nevada and Rhode Island. So those smaller casino and lottery markets end up counting for a lot.
- Number of casinos: 5
- Annual gross gaming revenue: $805 million
- Monthly casino revenue: $67.1 million
- Annual lottery sales: $1.38 billion
- Annual lottery spend per capita: $520
- Estimated monthly gambling spend per adult: $126.30
- Gambling as percentage of state personal income: 2.45%
#7 New York: Index Score 74/100 🎰
New York sells a ton of lottery tickets, $9.8 billion worth, enough for first place nationwide. But spread that across the population and it doesn’t look nearly as huge. Per adult, the monthly gambling is pretty modest, and less than 1% of personal income goes toward it, leaving New York seventh overall.
- Casinos: 11
- Annual casino GGR: $4.85 billion
- Monthly casino revenue: $404.2 million
- Annual lottery sales: $9.8 billion
- Lottery spend per capita: $625
- Estimated monthly gambling spend per adult: $79.10
- Gambling share of personal income: 0.98%
#6 Pennsylvania: Index Score 74/100 🎰
Gambling in Pennsylvania doesn’t really have a weak spot. Nothing leads the country, but just about every part of the market is well established by national standards. That’s enough for sixth place. And back in 2021, the state became the first ever to collect more than $1 billion in gambling tax revenue.
- Casinos: 17
- Annual casino GGR: $5.7 billion
- Monthly casino revenue: $475 million
- Annual lottery sales: $5.1 billion
- Lottery spend per capita: $490
- Estimated monthly gambling spend per adult: $88.50
- Gambling share of personal income: 1.23%
#5 Delaware: Index Score 76/100 🎰
Delaware’s got three casinos, all of them born out of racetracks. You wouldn’t expect that setup anywhere near the top five, but with barely a million people, even fairly modest totals work out to some of the highest per-person figures around.
- Casinos: 3
- Annual casino GGR: $510 million
- Monthly casino revenue: $42.5 million
- Annual lottery sales: $710 million
- Lottery spend per capita: $685
- Estimated monthly gambling spend per adult: $124.70
- Gambling share of personal income: 1.88%
#4 Massachusetts: Index Score 80/100🎰
Same as Delaware, Massachusetts has only three casinos. The fourth-place finish is mostly down to lottery play. Our analysis found about $856 spent per person each year, the highest number on the list.
- Casinos: 3
- Annual casino GGR: $1.19 billion
- Monthly casino revenue: $99.2 million
- Annual lottery sales: $6.15 billion
- Lottery spend per capita: $856
- Estimated monthly gambling spend per adult: $110.10
- Gambling share of personal income: 1.22%
#3 Rhode Island: Index Score 81/100 🎰
Rhode Island is so small you could fit about 150 of them inside Texas and still have room left over. With just 1.11 million people, monthly gambling spend per adult is twice what Colorado and Arizona produce combined. Only Nevada ranks higher, and even that’s not much of a fair comparison with tourists bringing so much outside money into the state.
- Casinos: 2
- Annual casino GGR: $715 million
- Monthly casino revenue: $59.6 million
- Annual lottery sales: $1.05 billion
- Lottery spend per capita: $512
- Estimated monthly gambling spend per adult: $172.50
- Gambling share of personal income: 2.51%
#2 New Jersey: Index Score 85/100 🎰
For nearly 50 years, if you wanted casino gambling in New Jersey, Atlantic City was it. The nine casino resorts there now generate almost $5.8 billion a year. Lottery sales add more, while tourist money pushes the per-adult number up some, enough for New Jersey to stay ahead of Rhode Island and Massachusetts.
- Casinos: 9
- Annual casino GGR: $5.78 billion
- Monthly casino revenue: $481.7 million
- Annual lottery sales: $3.72 billion
- Lottery spend per capita: $505
- Estimated monthly gambling spend per adult: $109.80
- Gambling share of personal income: 1.48%
#1 Nevada: Index Score 96/100 🎰
Nevada has no state lottery. And frankly, it gets along just fine without one, at least when it comes to leading America’s biggest gambling states. Vegas brings in plenty of weekend traffic from out of town, helping push the per-adult figure higher, just like in New Jersey, but on a much bigger scale. Then there’s the sheer number of casino properties. Nevada has about four times Oklahoma’s 130, the next-highest total.
- Casinos: 440
- Annual casino GGR: $15.5 billion
- Monthly casino revenue: $1.29 billion
- Annual lottery sales: $0
- Lottery spend per capita: $0
- Estimated monthly gambling spend per adult: $508.20
- Gambling share of personal income: 8.12%
Are America’s Biggest Gamblers Falling Behind Online?
Of America’s 10 biggest gambling markets, six allow at least one form of online gaming under local regulations: New Jersey, Pennsylvania, West Virginia, Delaware and Rhode Island. Nevada’s licensed interactive market is poker-only. That leaves four major players, New York, Massachusetts, Louisiana and Maryland, that still haven’t updated their online gambling laws. For now, much of it still happens the old-fashioned way, in person, even as the rest of the nation moves online.
The Full Ranking of America’s Biggest Gambling States
| Rank | State | Casinos | Annual GGR | Annual lottery spend per capita | Monthly gambling spend per adult | Personal income spent on gambling | Index score |
|---|---|---|---|---|---|---|---|
| 1 | Nevada | 440 | $15.5B | $0 | $508.20 | 8.12% | 96 |
| 2 | New Jersey | 9 | $5.78B | $505 | $109.80 | 1.48% | 85 |
| 3 | Rhode Island | 2 | $715M | $512 | $172.50 | 2.51% | 81 |
| 4 | Massachusetts | 3 | $1.19B | $856 | $110.10 | 1.22% | 80 |
| 5 | Delaware | 3 | $510M | $685 | $124.70 | 1.88% | 76 |
| 6 | Pennsylvania | 17 | $5.7B | $490 | $88.50 | 1.23% | 74 |
| 7 | New York | 11 | $4.85B | $625 | $79.10 | 0.98% | 74 |
| 8 | West Virginia | 5 | $805M | $520 | $126.30 | 2.45% | 73 |
| 9 | Louisiana | 24 | $3.15B | $170 | $88.40 | 1.42% | 70 |
| 10 | Maryland | 6 | $2.78B | $535 | $93.60 | 1.15% | 69 |
| 11 | Michigan | 26 | $3.58B | $490 | $88.90 | 1.41% | 68 |
| 12 | Mississippi | 26 | $2.52B | $235 | $110.90 | 2.15% | 67 |
| 13 | Indiana | 14 | $2.82B | $325 | $72.30 | 1.16% | 63 |
| 14 | Ohio | 11 | $3.31B | $470 | $70.80 | 1.09% | 63 |
| 15 | Illinois | 15 | $2.52B | $375 | $53.10 | 0.73% | 60 |
| 16 | Connecticut | 2 | $1.39B | $515 | $81.50 | 0.94% | 59 |
| 17 | Virginia | 3 | $1.05B | $597 | $70.40 | 0.91% | 57 |
| 18 | Missouri | 13 | $1.92B | $360 | $64.10 | 1.01% | 57 |
| 19 | Iowa | 19 | $1.89B | $190 | $80.10 | 1.18% | 55 |
| 20 | Georgia | 0 | $0 | $610 | $52.70 | 0.81% | 53 |
| 21 | Florida | 8 | $3.2B | $510 | $58.10 | 0.83% | 52 |
| 22 | California | 66 | $9.5B | $305 | $50.30 | 0.58% | 51 |
| 23 | Colorado | 33 | $1.34B | $190 | $39.80 | 0.49% | 47 |
| 24 | Oregon | 10 | $1.1B | $390 | $60.20 | 0.91% | 47 |
| 25 | Washington | 29 | $2.8B | $155 | $49.70 | 0.61% | 46 |
| 26 | South Dakota | 42 | $155M | $470 | $105.10 | 1.42% | 46 |
| 27 | New Mexico | 23 | $920M | $80 | $54.30 | 0.98% | 45 |
| 28 | Minnesota | 19 | $2.1B | $170 | $53.40 | 0.68% | 44 |
| 29 | Arizona | 26 | $2.6B | $245 | $46.50 | 0.89% | 43 |
| 30 | North Carolina | 3 | $650M | $510 | $50.10 | 0.77% | 43 |
| 31 | Kentucky | 0 | $450M | $410 | $45.60 | 0.74% | 42 |
| 32 | Maine | 2 | $175M | $340 | $41.80 | 0.67% | 40 |
| 33 | New Hampshire | 0 | $120M | $505 | $51.60 | 0.69% | 39 |
| 34 | Kansas | 10 | $910M | $150 | $46.40 | 0.69% | 38 |
| 35 | Arkansas | 3 | $620M | $250 | $42.20 | 0.76% | 38 |
| 36 | Oklahoma | 130 | $4.5B | $85 | $130.80 | 2.15% | 38 |
| 37 | South Carolina | 0 | $0 | $570 | $48.20 | 0.86% | 37 |
| 38 | Tennessee | 0 | $480M | $375 | $37.80 | 0.63% | 35 |
| 39 | Texas | 2 | $400M | $380 | $34.10 | 0.46% | 34 |
| 40 | Wisconsin | 24 | $1.4B | $195 | $41.40 | 0.63% | 34 |
| 41 | Vermont | 0 | $0 | $300 | $25.80 | 0.40% | 27 |
| 42 | Montana | 10 | $80M | $78 | $15.10 | 0.24% | 25 |
| 43 | Wyoming | 4 | $40M | $95 | $15.80 | 0.21% | 24 |
| 44 | North Dakota | 6 | $65M | $48 | $13.70 | 0.19% | 23 |
| 45 | Idaho | 7 | $180M | $275 | $32.40 | 0.52% | 22 |
| 46 | Nebraska | 4 | $110M | $145 | $18.50 | 0.26% | 20 |
| 47 | Alabama | 3 | $450M | $0 | $9.40 | 0.17% | 14 |
| 48 | Alaska | 0 | $0 | $0 | $0.00 | 0.00% | 4 |
| 49 | Hawaii | 0 | $0 | $0 | $0.00 | 0.00% | 0 |
| 50 | Utah | 0 | $0 | $0 | $0.00 | 0.00% | 0 |
How We Found America’s Biggest Gambling States
To find which parts of America gamble the most, our analysts at LegalUSPokerSites gathered publicly available data across five key gambling indicators for all 50 states.
We looked at legal casino gambling and lottery spending, using data from the American Gaming Association (AGA), National Indian Gaming Commission (NIGC), state gaming regulators, U.S. Census Bureau, Bureau of Economic Analysis (BEA), Motley Fool, and Statista.
The dataset includes eight measures covering gambling availability, revenue, and spending in each state:
- Casino count: Number of commercial and tribal casino properties. Source: AGA State of the States + NIGC gaming directory, 2025.
- Annual GGR: Total revenue from bets minus player payouts, before expenses and taxes. Source: AGA Commercial Gaming Revenue Tracker + state gaming regulators, 2025.
- Monthly casino revenue: Annual GGR divided by 12.
- Annual lottery sales: Total value of lottery tickets sold. Source: Motley Fool + Statista, 2025.
- Lottery spend per capita: Lottery sales adjusted for population. Source: Motley Fool + Statista + U.S. Census Bureau ACS, 2025.
- Monthly gambling spend per adult: Combines casino losses and lottery spending. Source: AGA + Census ASFIN + Census ACS, 2025.
- Share of personal income: Gambling spending relative to total income earned by state residents. Source: BEA Personal Income by State (SAINC1) + gambling totals, 2025.
- Composite score: Weighted 0–100 score used for the final ranking.
For the composite score, we adjusted the measures below for population and assigned them the following weights:
- Monthly gambling spend per adult: 30%
- Lottery spend per capita: 25%
- Gambling spend as a share of personal income: 20%
- Casino revenue per capita: 15%
- Casino property density: 10%
Casino GGR covers land-based casinos, commercial sports betting, and iGaming where legal. We then ranked states by their composite score, with #1 gambling the most overall and #50 the least.
What Gambling Reveals About the American Way of Life
Americans gamble, but they don’t all go about it the same way. Nevada brings in big money from casinos and gambling tourists, while Massachusetts gets near the top mostly off lottery tickets. In smaller states like Rhode Island, it’s the amount spent relative to population and income that stands out. Such differences reflect local laws, economies, access, and habits as much as people’s appetite for it. What’s a small part of the market in one state can be a major industry in another. At the end of the day, however you play, make sure you’re gambling responsibly.