


The 10 Best Cities in the USA for a Legendary Night Out
Whether it’s in neon-lit casinos, underground clubs, rooftop bars, or festivals that last all weekend, Americans really know how to
There’s spooky, and then there’s statistically unfortunate. With Halloween around the corner, we left the costume aisle behind and went looking for bad luck in the records. Turns out, Montana is America’s most cursed state.
The data draws on NOAA storm records and USGS earthquake reports from 2000–2025, alongside NASA’s historical meteorite falls. Alaska, for instance, accounts for more than half the earthquake count, while Texas somehow manages to check 18 of 20 hazard boxes. Meanwhile, Washington’s 727 Bigfoot reports make for one appropriately weird Halloween footnote.
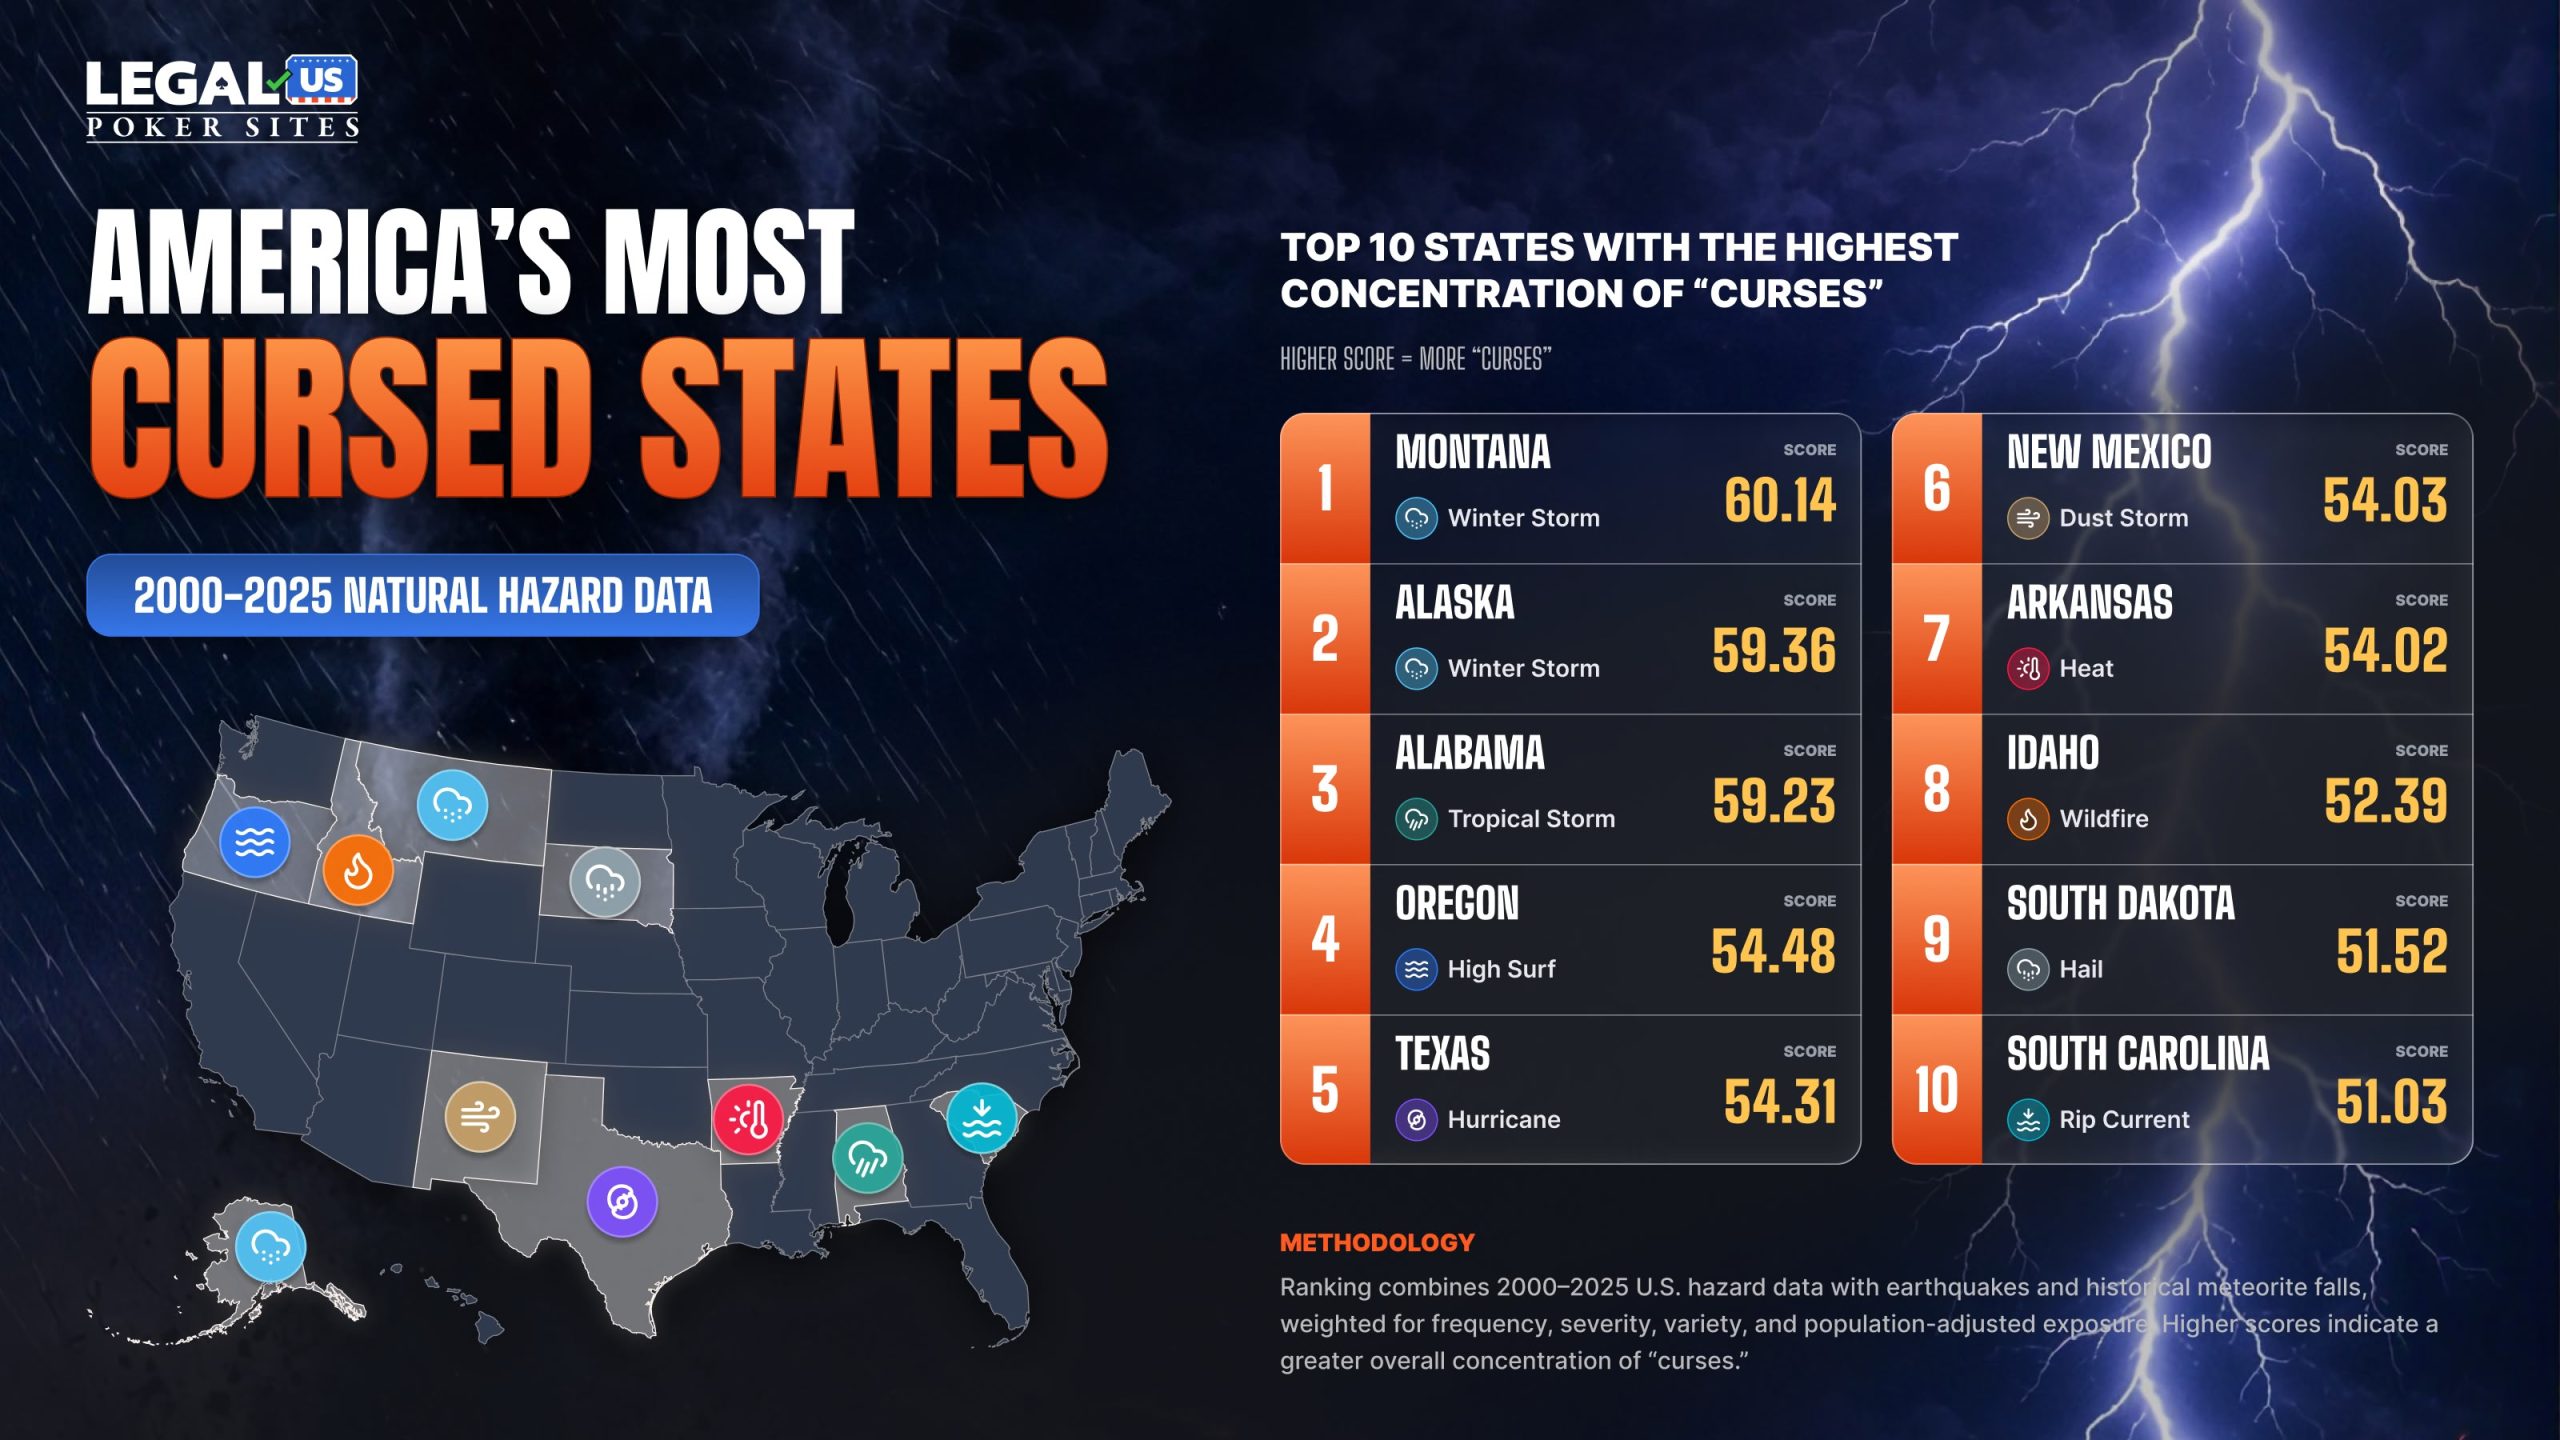
Montana owes its place atop the cursed state ranking to the relentless variety of ways nature can turn hostile. From 2000 to 2025, there were 1,964 winter storm episodes, enough to rank third in the country after adjusting for population. One late-September storm in 2019 alone dumped 52 inches on Babb and broke Great Falls’ 24-hour snowfall record with 17.7 inches.
Big Sky Country leads all 50 states for recurring natural misfortune, the heaviest weighted part of our index. Eight separate hazards make the national top five:
| Hazard | Episodes | National rate rank |
|---|---|---|
| Winter storm | 1,964 | 3 |
| High wind | 1,642 | 3 |
| Hail | 1,672 | 5 |
| Thunderstorm wind | 1,486 | 5 |
| Extreme cold | 141 | 3 |
| Wildfire | 177 | 4 |
| Avalanche | 50 | 3 |
| Ice storm | 25 | 3 |
Alaska comes in second, and no other entry has a calling card quite like it. Of the 3,084 magnitude 4.0+ earthquakes counted with epicenters inside a U.S. state from 2000 through 2025, more than half, 1,606 to be exact, happened right here. The Alaska Earthquake Center traces all that shaking to one brutal bit of geography where the Pacific Plate is forced beneath the North American Plate.
Above ground, no less than five hazards have the country’s highest population-adjusted rates, and four more are right behind in second.
| Hazard | Episodes | National rate rank |
|---|---|---|
| Earthquake (M4.0+) | 1,606 | 1 |
| Winter storm | 1,756 | 1 |
| Extreme cold | 144 | 1 |
| Ice storm | 63 | 1 |
| Coastal flood | 53 | 1 |
| High wind | 1,457 | 2 |
| Flood | 331 | 2 |
| Avalanche | 65 | 2 |
| High surf | 20 | 2 |
The curse of Alabama is having almost every box checked, 17 of 20 hazard types in all, second only to Texas. Sometimes everything piles on at once. On May 20, 2025, the northern part of the state was hammered by an outbreak involving 14 tornadoes, hail at least baseball size, damaging winds and flash flooding. A lightning strike also sparked the fire that destroyed Albertville Public Library.
Tropical storms account for a big share of the damage, Hurricane Ivan among them after slamming the Gulf Coast as a Category 3 in 2004, and 77 episodes in all work out to the second-highest rate in the country for a population that size, behind Mississippi.
Interestingly, despite ranking third overall, Alabama does not take first place in a single hazard category.
| Hazard | Episodes | National rate rank |
|---|---|---|
| Tropical storm | 77 | 2 |
| Waterspout | 17 | 3 |
| Hurricane | 10 | 4 |
| Lightning | 487 | 5 |
| Rip current | 47 | 5 |
Oregon’s number four spot comes from two very different kinds of trouble. Along the coast, high surf gets worse in Hawaii and Alaska, but nowhere else. 104 episodes from 2000 through 2025 put it third nationwide once population is taken into account. Even near the end of the data period in November 2025, the Pacific was still flexing hard enough for the National Weather Service to warn that 25 to 30 foot breakers could sweep people off rocks and jetties.
Moving inland, Oregon had 549 wildfire episodes, the fifth most in the country relative to population. Then came 2024, when nearly 1.9 million acres went up in flames. Nothing bigger had been documented since reliable statewide records began in 1992.
The number four finish also gets plenty of help from variety as 16 of the 20 core hazard types appear in the record, fifth among all 50. Unusual natural events place second nationally, while five freak categories among the seven tracked, including avalanches and dust devils, logged at least three episodes.
Speaking of variety, Texas would be first if that were the whole ranking. It qualifies in 18 of the 20 categories, more than any other state. Not one of them, however, make the national top five. Hurricanes get closest, with 19 episodes putting them ninth nationally, followed by dust storms and rip currents, both at twelfth. Another two reasons for the fifth-place finish are 78 magnitude 4.0+ earthquakes and 12 recorded meteorite falls.
The table below shows how all 50 fare in the cursed states ranking, from the roughest showing down to the bottom. We also flagged the hazard that puts each one in its weakest national position.
| Rank | State | Score out of 100 | Curse | What stands out |
|---|---|---|---|---|
| 1 | Montana | 60.14 | Winter storm | 1,964 winter-storm episodes |
| 2 | Alaska | 59.36 | Winter storm | More in-state earthquakes than the other 49 states combined |
| 3 | Alabama | 59.23 | Tropical storm | 17 of 20 hazard types |
| 4 | Oregon | 54.48 | High surf | 104 high-surf episodes |
| 5 | Texas | 54.31 | Hurricane | The only state with 18 of 20 hazards |
| 6 | New Mexico | 54.03 | Dust storm | 84 dust-storm episodes |
| 7 | Arkansas | 54.02 | Heat | Leads the country on its heat rate |
| 8 | Idaho | 52.39 | Wildfire | 374 wildfire episodes |
| 9 | South Dakota | 51.52 | Hail | Top five for 10 hazards |
| 10 | South Carolina | 51.03 | Rip current | 75 rip-current episodes |
| 11 | Wyoming | 50.84 | High wind | 1,474 high-wind episodes |
| 12 | North Carolina | 50.37 | Rip current | 139 rip-current episodes |
| 13 | Virginia | 50.31 | Coastal flood | 107 coastal-flood episodes |
| 14 | Colorado | 50.28 | Avalanche | 236 avalanche episodes |
| 15 | Washington | 49.90 | Avalanche | 727 Bigfoot reports, not part of the score |
| 16 | Kansas | 49.60 | Dust storm | 72 dust-storm episodes |
| 17 | Nevada | 48.63 | Dust devil | 30 dust-devil episodes |
| 18 | California | 48.57 | High surf | Widest mix of unusual events, 6 of 7 |
| 19 | Hawaii | 47.55 | High surf | 892 high-surf episodes |
| 20 | Oklahoma | 45.40 | Heat | 252 heat episodes |
| 21 | Wisconsin | 45.02 | Extreme cold | 176 extreme-cold episodes |
| 22 | Maine | 44.83 | Coastal flood | 77 coastal-flood episodes |
| 23 | Mississippi | 44.19 | Tropical storm | 48 tropical-storm episodes |
| 24 | Nebraska | 43.95 | Tornado | 599 tornado episodes |
| 25 | Delaware | 43.53 | Lightning | 108 lightning episodes |
| 26 | Louisiana | 43.41 | Hurricane | 24 hurricane episodes |
| 27 | Florida | 42.46 | Waterspout | 223 waterspout episodes |
| 28 | Arizona | 40.60 | Dust storm | 441 dust-storm episodes |
| 29 | Georgia | 39.90 | Hurricane | 11 hurricane episodes |
| 30 | North Dakota | 37.67 | Tornado | 383 tornado episodes |
| 31 | Utah | 35.82 | Avalanche | 82 avalanche episodes |
| 32 | Missouri | 34.00 | Heat | 333 heat episodes |
| 33 | Indiana | 33.60 | Rip current | 23 rip-current episodes |
| 34 | Iowa | 33.22 | Flood | 864 flood episodes |
| 35 | Maryland | 32.14 | Coastal flood | 142 coastal-flood episodes |
| 36 | Minnesota | 31.55 | Extreme cold | 335 extreme-cold episodes |
| 37 | New Jersey | 31.35 | Rip current | 86 rip-current episodes |
| 38 | Illinois | 30.86 | Extreme cold | 194 extreme-cold episodes |
| 39 | New York | 30.29 | Rip current | 44 rip-current episodes |
| 40 | Kentucky | 30.15 | Flood | 1,093 flood episodes |
| 41 | West Virginia | 30.05 | Ice storm | 61 ice-storm episodes |
| 42 | Vermont | 29.99 | Lightning | 68 lightning episodes |
| 43 | New Hampshire | 28.02 | Lightning | 141 lightning episodes |
| 44 | Pennsylvania | 26.57 | Ice storm | 79 ice-storm episodes |
| 45 | Tennessee | 26.23 | Tropical storm | 26 tropical-storm episodes |
| 46 | Michigan | 23.03 | Rip current | 41 rip-current episodes |
| 47 | Massachusetts | 22.30 | Coastal flood | 71 coastal-flood episodes |
| 48 | Rhode Island | 21.76 | Coastal flood | 11 coastal-flood episodes |
| 49 | Connecticut | 18.52 | Tropical storm | 11 tropical-storm episodes |
| 50 | Ohio | 15.52 | Flood | 886 flood episodes |
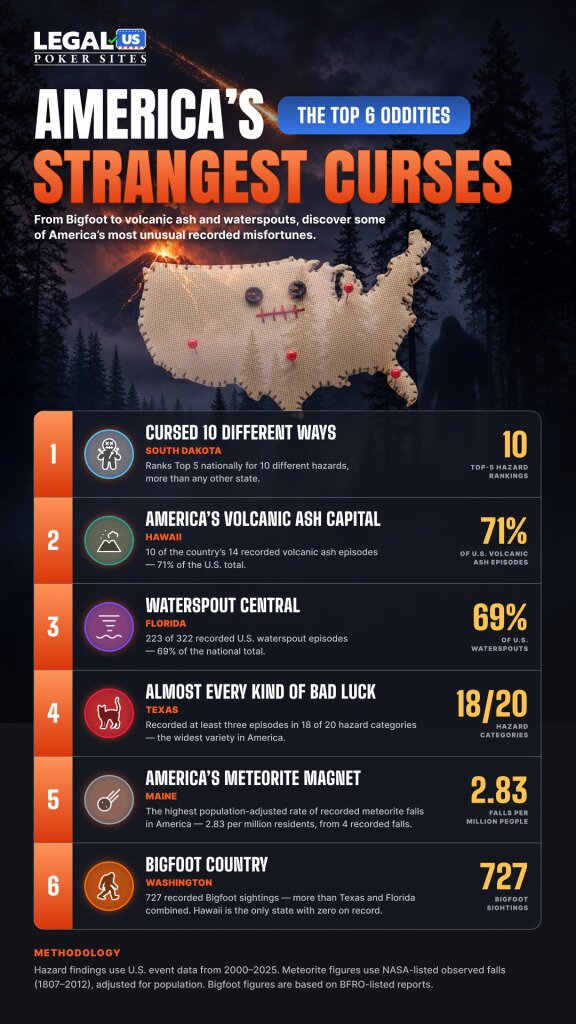
South Dakota shows up a whopping ten times in the national top five, more than anywhere else. Four even reach number one, them being thunderstorm wind, flood, flash flood and hail. The latter, chances are, is what locals talk about most. A 2010 supercell near Vivian dropped a hailstone measuring eight inches across and nearly two pounds, breaking U.S. records for both diameter and weight at the time.
| Hazard | Episodes | National rate rank |
|---|---|---|
| Hail | 4,523 | 1 |
| Thunderstorm wind | 3,009 | 1 |
| Flood | 702 | 1 |
| Flash flood | 431 | 1 |
| Tornado | 395 | 2 |
| Lightning | 90 | 3 |
| Extreme cold | 106 | 4 |
| High wind | 578 | 4 |
| Winter storm | 851 | 5 |
| Ice storm | 19 | 5 |
If Bigfoot’s from anywhere, you’d have to put your money on Washington. As of October 6, 2026, BFRO had logged 727 unverified reports there. We didn’t count any of that toward the ranking, though. The Evergreen State took 15th overall, and avalanches were the defining curse.
However, 727 claimed Bigfoot sightings is more than Texas and Florida combined; no other state comes close per person. Hawaii, meanwhile, had zero. Washington’s association goes back decades, especially around its mountains and Pacific coast. Skamania County even passed a 1969 ordinance against harming a Sasquatch.
NASA’s meteorite database uses the label “fell” for space rocks seen or recorded coming down between 1807 and 2012. Texas logged the most, 12 in all, and Kansas seven. Maine had just four, but once you account for the population, that works out to 2.83 per million residents. One of those, the 1898 Andover fall, was reportedly witnessed from about 25 feet away.
The Southwest gets two versions of dust trouble. Nevada leads the smaller, spinning kind, logging 30 dust-devil episodes. New Mexico is next on 16. Despite the name, these don’t require particularly sinister weather. The National Weather Service says one can form under sunny skies and light winds once the ground gets hot enough to warm the air above.
In Arizona, haboobs often form when thunderstorm winds race across desert ground and kick up towering dirt walls. Those, alongside events stirred by cold fronts or other strong airflow, helped account for about 40% of dust storms across the U.S., totaling 441 from 2000 through 2025. Second again is New Mexico with 84 episodes.
The Florida Keys are so waterspout-prone, research puts their frequency above anywhere else in the world. The next busiest U.S. stretch is the southeast coast between Stuart and Homestead. Our data has 223 episodes across the Sunshine State, about 69% of the country’s total.
Hawaii, meanwhile, accounted for 10 of the national sample’s 14 volcanic ash records. Kīlauea’s 2018 eruption sent ash more than 10,000 feet into the air and over downwind communities. As for the Hawaii curse in this ranking, that title goes to high surf. The state finished 19th overall.
Depends what it takes, in your book, to call a state cursed. One thing’s for sure, though, anywhere you look, there’s at least one thing counting against the place.
Comparatively, Ohio, Connecticut and Rhode Island got off pretty lightly across most categories. Montana, on the other hand, drew the short straw here. Eight separate hazards rank among the five worst in the country, from winter storms and extreme cold to wildfire and avalanches.
Alaska and Alabama follow close behind, both pulled upward by problems spanning several fronts. Texas then qualifies in 18 of 20 hazard categories, more than anywhere else, while South Dakota made the national five across 10 hazards.
And since we’re very much in the Halloween spirit, Washington, despite not ranking among the top 10 most haunted states, deserves a mention for all those Bigfoot reports. Maybe the bigger problem is that none of those counted toward the score, yet it still came in 15th, well inside the first third of America’s cursed state ranking.
To rank America's most cursed states, we analyzed NOAA Storm Events and USGS earthquake records from 2000–2025, alongside historical NASA meteorite falls (1807–2012) and U.S. Census Bureau population data.
Each state received a Cursed Score out of 100, based on five weighted factors:
NOAA events were grouped into 20 hazard categories, with duplicate reports across counties and forecast zones removed. Event frequencies were adjusted using summed annual populations (person-years) from 2000–2025 for NOAA and earthquakes, while meteorites used July 1, 2025 population. Variety measures required at least three recorded episodes per category.
Each state's primary curse reflects its strongest population-adjusted hazard ranking, requiring at least 10 episodes in both the state and nationwide.
The ranking covers all 50 states and measures documented events, not deaths, injuries, damage, or future risk. Bigfoot reports were sourced from the Bigfoot Field Researchers Organization (BFRO) on for interest only and did not affect the score. Only observed meteorite falls were counted.
Whether it’s in neon-lit casinos, underground clubs, rooftop bars, or festivals that last all weekend, Americans really know how to

Does love sometimes feel like a losing game? It might not just be bad luck—some states seem to have the

The U.S. is the birthplace of poker, with Las Vegas reigning as its gambling capital. From the East Coast grit